web篇 关键字:shell mysql python web.py
在上一篇中,我们介绍了如何使用shell脚本监控系统状态,并在出现异常时通过email发送警报。但email报警有一个弊端,无法实时了解服务器的运行状态。为了满足这一需求,就要开发一个web程序,通过网页的方式来显示所有服务器的实时运行状态。
原理 定时执行监控脚本提取服务器运行相关信息,如系统负载、磁盘空间等,将这些信息入到mysql数据库中。开发一个web程序,当用户通过浏览器访问web监控页面,web程序读取mysql数据库中服务器的数据,以网页的形式展现给用户。
实例 下面我们通过一个实例来详细讲解。共用到3台服务器,一台监控服务器serverM(60.11.232.17),用于存放我们web程序和mysql数据库,还有两台被监控服务器,server1(199.83.55.39)和server2(59.66.7.124).
首先在监控服务器serverM上创建一个数据库monitor:
1
2
mysql -p create database monitor
在monitor数据库中创建一个servers表,用于存放监控数据:
1
2
3
4
5
6
7
8
9
use monitor create table servers ( id int not null primary key auto_increment, hostname varchar(20), ip varchar(64), rootpartion varchar(64), uptime varchar(64), time timestamp )
添加一个用户user1,并让其有访问monitor数据库的权限:
1
2
grant all privileges on monitor.* to 'user1' @'%' identified by 'Root123' ; flush privileges
在被监控服务器server1和server2上执行以下命令,看能否正常连接的到监控服务器serverM的数据库
1 mysql -h60.11.232.17 -uuser1 -pRoot123 monitor
接下来是被监控服务器上的shell监控脚本,和email篇 中的脚本大体相似,多了一个入库的操作:
1
2
3
4
5
6
7
8
9
10
11
12
13
14
15
16
17
18
19
20
21
22
23
24
25
26
27
28
29
30
31
32
33
34
35
36
37
38
39
40
41
# !/bin/bash # Server status monitor # by caishzh 2013 # 初始化变量及设置阀值 MYSQL="mysql -h60.11.232.17 -uuser1 -pRoot123 monitor -e" #数据库连接语句 DIR="/tmp" NOW=$(date "+%F %T") > ${DIR} /messages.txt ADMIN="[email protected] " #你的邮箱地址 HOSTNAME=$(hostname) #这里也可以手动指定服务器名 如:HOSTNAME="Server1" IP=$(ifconfig eth0|grep 'inet addr'|sed 's/.*addr:\(.*\) Bcast:.*/\1/') UPTIME_MAX=3 #系统负载 DISK_MAX=90 #磁盘使用率 # 系统负载 UPTIME=$(uptime|sed 's/^.*age: \(.*\)$/\1/') UPTIME_NOW=$(echo $UPTIME|awk -F',' '{print $1}') if echo "$UPTIME_NOW>$UPTIME_MAX"|bc >/dev/null;then echo "UPTIME: $UPTIME" >>${DIR}/messages.txt fi # 根分区 DISK=$(df -h|grep /$|awk '{print $5,$2,$4}') DISK_USAGE=$(echo $DISK|awk '{print $1}'|tr -d '%') [ "$DISK_USAGE" -ge "$DISK_MAX" ] && $(echo "DISK: $DISK" >> ${DIR}/messages.txt) # 如果messages.txt文件不为空则发送警报信 if [ -s ${DIR}/messages.txt ];then mail -s "system monitor: $NOW $IP $HOSTNAME" "$ADMIN" < ${DIR}/messages.txt fi # 将服务器运行状态数据入到mysql数据库中 # 第一次执行插入一条新记录,后续则更新记录 if [ -n "$1" ];then $MYSQL "insert into servers(hostname,ip,rootpartion,uptime,time) values('$HOSTNAME','$IP','$DISK','$UPTIME',now())" else $MYSQL "update servers set rootpartion='$DISK',uptime='$UPTIME',time=now() where hostname='$HOSTNAME'" fi
将脚本放到被监控服务器/root/tool目录下,给予执行权限:
1 chmod 755 /root/tool/system_monitor.sh
放入crontab中,每3分钟执行一次:
1 echo "*/3 * * * * root /root/tool/system_monitor.sh" >>/etc/crontab
第一次需要手动执行如下命令,命令后加任意参数,这样可以在数据库插入一条新记录:
1 /root/tool/system_monitor.sh 1
此时,数据库的监控数据如下:
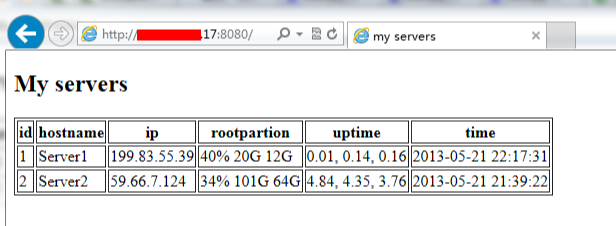
1
2
3
4
5
6
7
8
9
10
mysql> use monitor; Database changed mysql> select * from servers; +----+----------+--------------+--------------+------------------+---------------------+ | id | hostname | ip | rootpartion | uptime | time | +----+----------+--------------+--------------+------------------+---------------------+ | 1 | Server1 | 199.83.55.39 | 40% 20G 12G | 0.45, 0.23, 0.28 | 2013-05-21 21:39:06 | | 2 | Server2 | 59.66.7.124 | 34% 101G 64G | 4.84, 4.35, 3.76 | 2013-05-21 21:39:22 | +----+----------+--------------+--------------+------------------+---------------------+ 2 rows in set (0.00 sec)
到监控服务器serverM,下载安装web.py框架( web.py 是一个轻量级Python web框架,它简单、方便而且功能大):
1
2
3
4
wget http://webpy.org/static/web.py-0.37.tar.gz tar zxvf web.py-0.37.tar.gz cd web.py-0.37python setup.py install
新建编辑code.py文件(代码很简单,就不注释了,不清楚的建议先看下web.py的新手指南 ):
1
2
3
4
5
6
7
8
9
10
11
12
13
14
15
16
17
18
19
20
21
22
23
import web urls=( '/' ,'index' ) render = web.template.render('templates/' ) db = web.database( host = '127.0.0.1' , dbn = 'mysql' , user = 'user1' , pw = 'Root123' , db = 'monitor' ) class index : def GET (self) : servers=db.select('servers' ) return render.index(servers) if __name__ == "__main__" : app = web.application(urls,globals()) app.run()
新建一个模版目录templates,在该目录下新建index.html
1
2
3
4
5
6
7
8
9
10
11
12
13
14
15
16
17
18
19
20
21
22
23
24
25
26
27
28
29
30
31
32
33
34
35
$def with(servers) < !DOCTYPE html > <html > <head > <meta http-equiv ='Content-Type' content ='text/html; charset=utf-8' /> <title > my servers</title > </head > <body > <span > <h2 > My servers</h2 > </span > <table border ='1' > <tr > <th > id</th > <th > hostname</th > <th > ip</th > <th > rootpartion</th > <th > uptime</th > <th > time</th > </tr > $for server in servers: <tr > <td > $server.id</td > <td > $server.hostname</td > <td > $server.ip</td > <td > $server.rootpartion</td > <td > $server.uptime</td > <td > $server.time</td > </tr > </table > </body > </html >
是不是很简单,加起来还不到100行的代码^_^
启动web服务:
默认启动在8080端口,如果不想使用默认端口,使用以下命令:
如果提示ImportError: No module named MySQLdb,表示没有安装MySQLdb模块,使用apt-get安装下就行了:
1 apt-get install python-mysqldb
最后使用浏览器访问,效果如下:
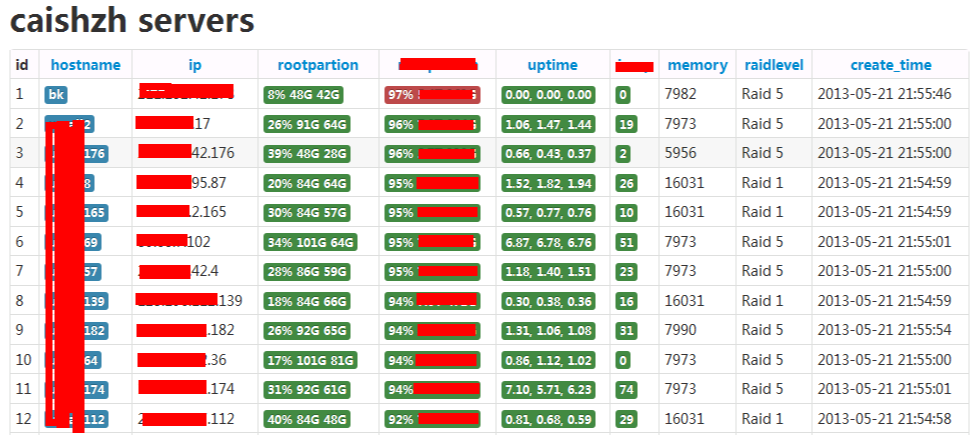
配合css样式表,可以做出漂亮的界面,以下截图是本人部分服务器的监控界面。
==========================================================20130715,php版:
1
2
3
4
5
6
7
8
9
10
11
12
13
14
15
16
17
18
19
20
21
22
23
24
25
26
27
28
29
30
31
32
33
34
35
36
37
38
<html> <head> <meta http-equiv='Content-Type' content='text/html; charset=utf-8' /> <title>my servers</title> </head> <body> <h2>My servers</h2> <table border='1' > <tr> <th>id</th> <th>hostname</th> <th>ip</th> <th>rootpartion</th> <th>uptime</th> <th>time</th> </tr> < ?php $link=@mysql_connect("127.0.0.1" ,"user1" ,"Root123" ) or die ("连接数据库失败" ); mysql_select_db("monitor" ,$link); $sql="select * from servers" ; $res=mysql_query($sql,$link); while ($rows=mysql_fetch_assoc($res)){ echo "<tr>" ; echo "<td>${rows['id']}</td>" ; echo "<td>${rows['hostname']}</td>" ; echo "<td>${rows['ip']}</td>" ; echo "<td>${rows['rootpartion']}</td>" ; echo "<td>${rows['uptime']}</td>" ; echo "<td>${rows['time']}</td>" ; echo "" ; } ?> </table> </body> </html>
参考 简明python教程 http://webpy.org/